quran understand quran
understand quran quran

Graph of   Inequality   of Math.


User Manual for graphing

This is an online educational tools to make graph of mathematical inequality of 2D in this section. Type any mathematical expressions in the left input box, right input box, select the inequality sign( > or < ) in the middle and then the graph will drawn automatically. It takes sometimes to draw graph of this inequality and be patience to calculate huge points to draw the graph. For zoom this graph, you can change the x-scale and y-scale. It can draw any inequality of two variables. You can see the user manual for properly use this online tools. Thank you for viewing this article.

1. The vedio Tutorial link: Youtube vedio tutorial for Inequality of math
2. For inequality of math, you will type inequality of variables x and y in two input boxes and inequality sign( > or < ) is situated between two input boxes.
3. Drawing the inequality of math graph, it will take some times. May be 2 sec to 1 min. Hence, be pateince.
4. For some approxiamation error, the shape will remain unchanged. sorry for that.
5. If you need to write π, then you must write pi or PI or Pi
How to get update website

To get update website, you can clear your browser chache data (if you browse this website before many days) or browse this website with another website browser. Steps for clear chache: 1. on your computer, open browser. 2. At the top right, click More. 3. Click More tools. Clear browsing data. 4. choose a time range. 4. "Cached images and files," check the boxe. 5. Click Clear data. Different browser may have different ways.


Definition and graph of inequality of Mathematics

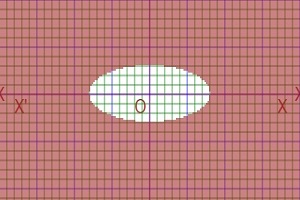
The relationship between two variables x and y which are not equal is defined inequality of mathematical expression. As for example, x^2/64+3y^2/25>1 . For learn about Piecewise function of Mathematics and graphing, visit: Graphing Piecewise function of Math.

graph of inequality of math or graphing inequalities calculator

Number line inequality grapher of Mathematics

A Number line is represented by a line or line segment on x-axis whose length may be finite or infinite.Any real number can be represent on a number line, such as fractions,rationals, irrationals, decimals, integers etc. The solution of a inequality can be represented by a Number line. As for example, |2x-7|>13 is an inequality whose solution -3<x<10 is represented a number line is given bellows

number line inequality grapher

As for another example, 2x-1>9 is an inequality whose solution x>5 is represented a number line is given belows.

number line graph generator

Inequality of complex number of Mathematics

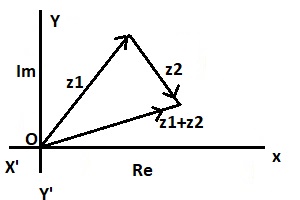
Triangle Inequality of complex numbers :If z1 and z2 are two complex numbers and |z1|,|z2| and |z1 + z2| are modulus of z1, z2 and z1+z2 respectively, then the Triangle Inequality of complex numbers is |z1 + z2|≤|z1| + |z2|. This theorem is generalized by |z1 + z2 + z3+....+zn|≤|z1| + |z2|+|z3|+.....+|zn|.

graph of Triangle Inequality of complex numbers

How to convert Modulus or absolute value inequality to normal inequality

Assume |x-a| < r is a Modulus or absolute value inequality, we want to convert it to normal inequality.

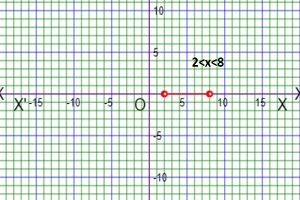
Now |x-a| < r => -r < x-a < r => a-r < x < a+r. As for example |x-5| < 3 => -3 < x-5 < 3 => 5-3 < x-5+5 < 5+3 => 2 < x < 8
graph of convert Modulus inequality to normal inequality
again we calculate for Vice versa, Assume a < x < b is a normal inequality, then subtracting (a+b)/2 in all sides, we get a-(a+b)/2< x-(a+b)/2 < b-(a+b)/2 => (a-b)/2 < x < (b-a)/2 => -(b-a)/2 < x < (b-a)/2 =>|x| < (b-a)/2. As for example 3 < x < 5 is a normal inequality, then subtracting (3+5)/2=4 with all sides, we get 3-4 < x-4 < 5-4 => -1 < x-4 < 1 => |x-4| <1

Inequality of ceiling function and floor functions

The inequality of ceiling function is defined by the smallest integer value which is greater than or equal to the specified number. The Ceiling function is denoted by ⌈x⌉. So ⌈x⌉=n where x≤n<x+1

The inequality of floor function is defined by the largest integer value which is less than or equal to the specified number. The Floor function is denoted by ⌋x⌊ So ⌋x⌊=n where x-1<n≤x

Finding the concavity interval of a function with graphing

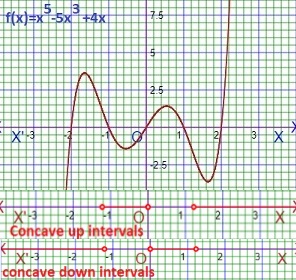
Let us consider a function f(x)=x5-5x3+4x and the second derivative f''(x)=20x3-30x. Now f''(x)>0 for concave up interval and f''(x)<0 for concave down interval. We can find the concave up and concave down intervals with this graphing inequality page by inputing 20x3-30x and select less than or greater than sign, then we get number line of the inequality. The graph of the function f(x) and the numbeer line of its concavity is given belows.
graph of concavity with inequality graphing