quran understand quran
understand quran quran

Free Graphing piecewise function calculator of math


User Manual for graphing

This is an online educational tools to make graph of mathematical piecewise functions of 2D in this section.We can use maximum four functions and four conditions respectively. If you could not find < or > or <= or >= sign, then you can copy any where or here and past it. Type any mathematical function in the left input box , any valid condition in the right input box and then press the drawing button. It takes sometimes to draw graph of this function and be patience to calculate huge points to draw the graph. For zoom this graph, you can change the x-scale and y-scale. It can draw any piecewise function. You can see the user manual for properly use this online tools. Thank you for viewing this article.

1. The vedio Tutorial link: Youtube vedio tutorial for piecewise functions
2.We can use maximum four functions of variable x and four conditions respectively for piecewise function. If you could not find < or > or <= or >= sign, then you can copy any where or here and past it.Type any mathematical function in the left input box , any valid condition in the right input box and then press the drawing button. It takes sometimes to draw graph of this function and be patience to calculate huge points to draw the graph. For zoom this graph, you can change the x-scale and y-scale. As for example of the interval or conditions, write 1<=x<=3 for [1,3] , x!=3 for x is not equal to 3. If you need to write π, then you must write pi or PI or Pi
How to get update website

To get update website, you can clear your browser chache data (if you browse this website before many days) or browse this website with another website browser. Steps for clear chache: 1. on your computer, open browser. 2. At the top right, click More. 3. Click More tools. Clear browsing data. 4. choose a time range. 4. "Cached images and files," check the boxe. 5. Click Clear data. Different browser may have different ways.


How to draw graph of piecewise function with piecewise function calculator

The piecewise function is defined by multiple sub-functions, where the sub-function are in defined as the different interval in the Domain. As for example, graph of piecewise function(modulus function) or how to draw modulus function graph

For sketching the graph of modulus or absolute value function with piecewise function calculator, the graph of the right side of y axis (x>=0) is a straight line y=x and the graph of the left side of y axis(x < 0 ) is a straight line y=-x. Both part of the graph is situated on the upper side of x-axis. For sketching this graph with online free website www.graph2d.com, type x in the first row first input box and the condition x>=0 in 2nd input box. Again type -x in the second row first input box and the condition x< 0 in 2nd input box.Then press drawing button to get the graph of the modulus function

graph of piecewise function(modulusfunction) or graphing absolute value function calculator

Graphing absolute value function calculator can run any device and any website browser.

How to find the value of a piecewise function and sketch with piecewise function calculator

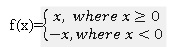
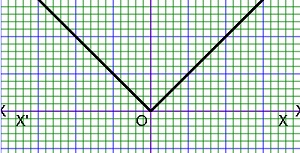
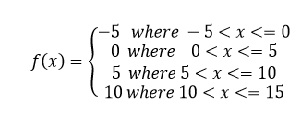
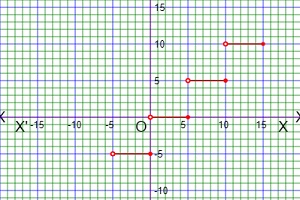
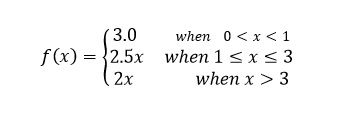
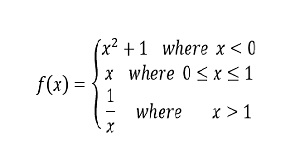
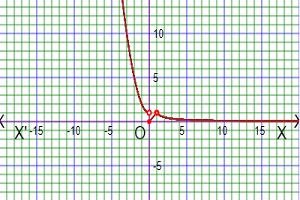
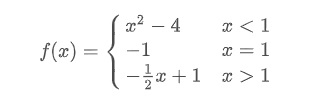
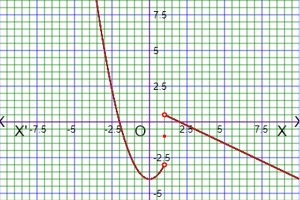
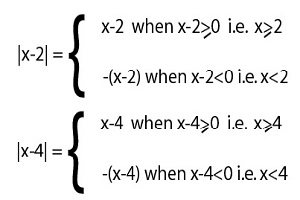
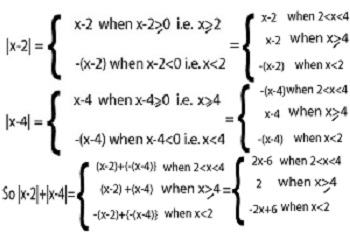
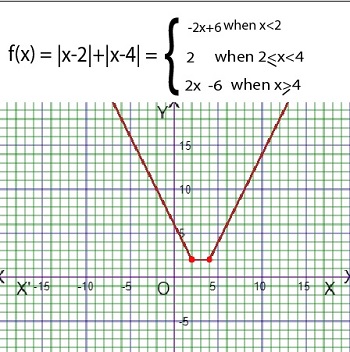
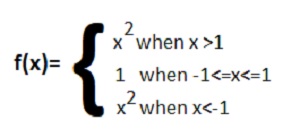
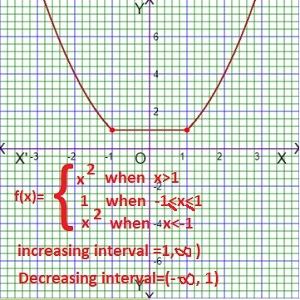
As for example, a piecewise function is given bellows-
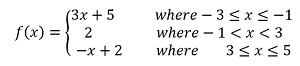
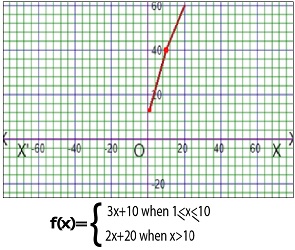
piecewise function picture or graphing piecewise functions

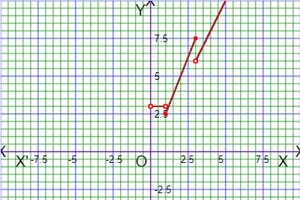
For finding the value of f(-2), f(-1), f(0) and f(4), we will check the values of x is situated in which intervals . If x=-2,then it is situated in the 1st interval and this interval corresponding to the function 3x+5, so f(-2)=3(-2)+5=-6+5=-1. If x=-1,then it is situated in the 1st interval and this interval corresponding to the function 3x+5, so f(-1)=3(-1)+5=-3+5=2. If x=0,then it is situated in the 2nd interval and this interval corresponding to the constant function 2, so f(0)=2. If x=4,then it is situated in the 3rd interval and this interval corresponding to the function -x+2, so f(4)=-4+2=-2. The graph of the given function is given bellows-

piecewise function graph or graphing piecewise functions calculator

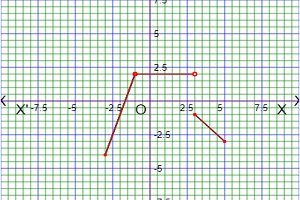
We can find out the Domain and Range of the function from the graph. At first we check the graph is situated what interval along x-axis for Domain. We can see the graph is situated in the interval [-3, 5], so Domf=[-3, 5]. Again we check graph is situated what interval along y-axis for Range. We can see the graph is situated in the interval [-4, 2], so Domf=[-4, 2].

Graphing piecewise functions calculator can run any device and any website browser.

How to draw graph of piecewise another function example with piecewise function calculator

The piecewise function another example, graph of piecewise function or steps function calculator

For sketching the graph of Piecewise function with piecewise function calculator , there are four input boxes for four sub-functions in left side and another four input boxes for corresponding conditions in right side. For sketching this graph with online free graph drawing website www.graph2d.com, type 2x+15 in the first row first input box and the condition x< -5 in 1st row 2nd input box. Again type abs(x) in the second row first input box and the condition -5<=x<=5 in 2nd row 2nd input box.Again type -2x+15 in the 3rd row first input box and the condition x>=5 in 3rd row 2nd input box. Then press drawing button to get the graph of that piecewise function

graph of piecewise function or step function graph calculator
Step function or Staircase function

Step function or Staircase function f : R->R is a types of piecewise constant function which has finite number of pieces. As for example, consider a step function or a staircase function staircase function

This Step function or Staircase function's Domain =(-5,0]U(0,5]U(5,10]U(10,15]=(-5,15] , Range ={-5,0,5,10} and the graph of this step function or staircase function is given bellows

step function graphing calculator

Step function graphing calculator can run any device and any website browser.

use of piecewise function in real life or applications of a piecewise function in real life

For uses or application or real life example on piecewise function , we can consider taxicab fare. let initial fare of a taxicab is 3.0 $ for less than 1 km, Short trip fare is 2.5 $ per km for 1km to 3 km and long trip fare is 2.0 $ per km for grater than 3 km. For this situation, we can make a piecewise function is given bellows-

uses or application or real life example on piecewise function

Here x is denoted as total km and f(x) is toal taxicab fares. Now a passenger is going to a short trip for 2 km, then the total taxcab fare will be f(2)=2X2.5=5 $ and another passenger is going to long trip for 12 km, then total fare will be f(12)=2X12=24 $

Graph of this piecewise function (Drawing with piecewise function calculator ) is given bellows which is Uses or Application or Real life example on piecewise function

graph of uses or application or real life example on piecewise function with answers
domain and range of a piecewise function

As for example, consider a piecewise function for calculating domain and range.

domain and range from the graph of a piecewise function

For calculating the domain of piecewise function, together with the union of those three intervals from the three sub-functions conditions. So the domain=(-∞, 0)∪[0, 1]∪(1, ∞)=(-∞, ∞)

domain and range of a piecewise function

Calculating the range of this piecewise function:

For the First sub-function f(x)=x2 where x<0 , we can get the range interval 02+1<f(x)<(-∞)2+1 ⇒ 0<f(x)<∞

For the second sub-function f(x)=x where 0 ≤ x≤ 1 , we can get the range interval f(0) ≤ f(x) ≤ f(1) ⇒ 0 ≤ f(x) ≤ 1

For the Third sub-function f(x)=1/x where x>1 , we can get the range interval 1/f(∞) < f(x) < 1/f(1) ⇒ 1/∞ < f(x) < 1/1 ⇒ 0 < f(x) < 1

Now together with the union of this three range intervals, we get the range=(0, ∞)∪[0, 1]∪(0, 1)=[0, ∞)

Now again from the graph of this piecewise funtion, we see the graph is situated from left to right all over x-axis, so the domain=(-∞, ∞) and the graph is situated from origin to upper side all over the positive y-axis, so the range=[0,∞)

Domain and Range of a piecewise function can be guess from its graph.

Limit of a piecewise function at a point

Let us consider a piecewise function for calculating limit at a point is given bellows-

piecewise function for limit

The graph of this piecewise function for calculating limit at a point is given bellows-

graph of piecewise function for limit

If we are calculating the limit of a piecewise defined function at the point where the function changes its sub-functions, then we will have to take one-sided limits separately named left hand limit (L.H.lim) and Right hand limit (R.H.lim) . If L.H.lim=R.H.lim, then the limit exist at that point , otherwise the limit does not exists at that point .

For calculating the limx->1 f(x), we will calculate left hand limit (L.H.lim) and Right hand limit (R.H.lim) at the point x=1. So at x=1, L.H.lim= limx->1- f(x)=limx->1- x2=1 and R.H.lim=limx->1+ f(x)=limx->1+ x=1. Since L.H.lim=R.H.lim at x=1, so the limit exist at x=1 and limx->1 f(x)=1


For calculating the limx->2 f(x), we will calculate left hand limit (L.H.lim) and Right hand limit (R.H.lim) at the point x=2. So at x=2, L.H.lim= limx->2- f(x)=limx->2- x=2 and R.H.lim=limx->2+ f(x)=limx->2+ (2x-1)=3. Since L.H.lim=R.H.lim at x=2, so the limit does not exist at x=2.

Continuity and Discontinuity of a piecewise function at a point

A piecewise Function that can be drawn without lifting up your pencil is called continuous piecewise functions. For calculating, If L.H.lim=R.H.lim=f(a) at x=a, then it is continuous at x=a otherwise it is discontinuous at x=a.


Let us consider a piecewise function for calculating discontinuity at a point is given bellows-

discontinuous piecewise function

The graph of this piecewise function for calculating discontinuity at a point is given bellows-

graph of discontinuous piecewise function

For calculating the discontinuity of this piecewise function at x=1, we will calculate L.H.lim, R.H.lim at x=1 and the function value f(1). So at x=1, L.H.lim=limx->1- f(x)=limx->1- x2-4=12-4=-3, R.H.lim=limx->1+ f(x)=limx->1+ -(1/2)x+1=-(1/2)(1)+1=1/2 and f(1)=-1. Since at x=1, L.H.lim≠R.H.lim≠f(1) , hence f(x) is discontinuous at x=1.


Let us consider another piecewise function for calculating continuity at a point is given bellows-

continuity of piecewise function at a point

The graph of this piecewise function for calculating continuity at a point is given bellows-

graph of continuity of piecewise function at a point

For calculating the continuity of this piecewise function at x=4, we will calculate L.H.lim, R.H.lim at x=4 and the function value f(4). So at x=4, L.H.lim=limx->4- f(x)=limx->4- -x+5=-4+5=1, R.H.lim=limx->4+ f(x)=limx->4+ x-3=4-3=1 and f(4)=-4+5=1. Since at x=4, L.H.lim=R.H.lim=f(4)=1 , hence f(x) is continuous at x=4.

composite Piecewise functions or composition of piecewise functions

Let us consider two piecewise functions f(x) , g(x) and their graphs for create composite Piecewise functions or composition of piecewise functions are given bellows-
graph of composite piecewise function1 graph of composite piecewise function2
we can divide the whole set of real numbers into three parts such as x<1, 1≤x<3 and x≥3.
Now for x<1, we get f(x)=x2 and g(x)=2x. So the composite Piecewise functions or the composition of piecewise functions are (fog)(x)=f(g(x))=f(2x)=(2x)2=4x2 and (gof)(x)=g(f(x))=g(x2)=2(x2)=2x2

Again for 1≤x<3, we get f(x)=2x+1 and g(x)=2x. So the composite Piecewise functions or the composition of piecewise functions are (fog)(x)=f(g(x))=f(2x)=2(2x)+1=4x+1 and (gof)(x)=g(f(x))=g(2x+1)=2(2x+1)=4x+2

Again for x≥3, we get f(x)=2x+1 and g(x)=2x2-1. So the composite functions or the composition of the functions are (fog)(x)=f(g(x))=f(2x2-1)=2(2x2-1)+1=4x2-1 and (gof)(x)=g(f(x))=g(2x+1)=2(2x+1)2-1=2(4x2+4x+1)-1=8x2+8x+1

Now combine for the three intervals, we get the composite Piecewise functions or composition of piecewise functions and their graphs are given bellows-

graph of composition piecewise function fog graph of composition piecewise function gof

Conversion absolute value function of multiple absolute value to piecewise function

Let us consider a absolute value function of multiple absolute value f(x)= |x-2| + |x-4|

we can divide the whole set of real numbers into three parts such as x<2, 2≤x<4 and x≥4.
By the definition of absolute value function, we get graph of absolute value function of multiple absolute value.jpg

Now for x<2, we get f(x)=|x-2| + |x-4|=-(x-2)+{-(x-4)}=-x+2-x+4=-2x+6.
Again for 2≤x<4, we get f(x)=|x-2| + |x-4|=(x-2)+ {-(x-4)} =x-2-x+4=2
Again for x≥4, we get f(x)= |x-2| + |x-4|=(x-2)+ (x-4) =2x-6
Now combine for the three intervals, we get the Piecewise functions and their graphs are given bellows-
graph convert absolute value function of multiple absolute value to piecewise function graph combine absolute value to piecewise function.jpg

Determine a Piecewise Linear Cost Function for business
Suppose that a small company produce a product has fixed cost $10 and the first 10 dozen items cost $3 each dozen to produce. After that, each dozen item cost $2 to produce. This piecewise cost function has two parts. We will determine the piecewise linear cost function for business in terms x dozens for the two parts. For the first part, the cost function f(x)=3x+10 when 1<=x<=10 and for the second part, the cost function f(x)=3X10+2(x-10)+10=2x+20 when x>10. This linear piecewise cost function and it's graph is given bellows-
graph piecewise linear cost function