In Mathematics, we can maximize or minimize value of objective functiopn of linear programming of large values inequalities
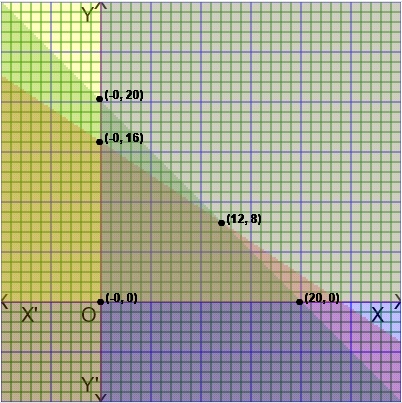
As for example, A linear programming problem is Maximize Z=f(x,y)=4x+3y and constraints are x+y<=50, x+2y<=80,2x+y>=20, x>=0, y>=0. Since the region size 30×30.
So For solving this linear programming problem, we can divide right sides of inequalities by 2 Such as x+y<=25, x+2y<=40, 2x+y>=10, x>=0, y>=0 .
type x+y<=25 in the first input box, type x+2y<=40 in the second input box, 2x+y>=10 in the third input box, x>=0 in the fourth input box, y>=0 in the 5-th input box and then the graph will drawn automatically of the inequalities. The graph of that inequalities is given belows.
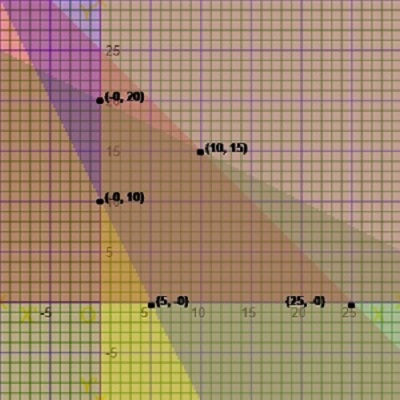
Then click the feasible area and also click or touch the co-ordinate of turning points. We get the relative turning points (0,20), (0,10), (5,0), (25,0), (10,15).
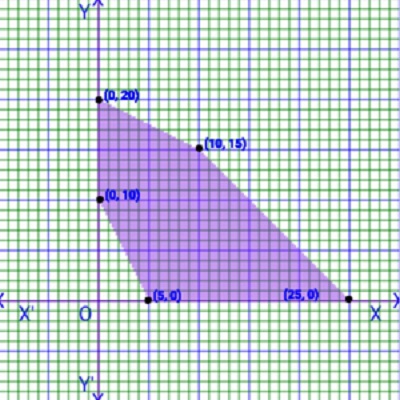
Multiply by 2 for getting actual turning points which are (0,2×20)=(0,40), (0,2×10)=(0,20), (2×5,0)=(10,0), (2×25,0)=(50,0), (2×10,2×15)=(20,30),
So Z=4x+3y=4×0+3×40=120, Z=4×0+3×20=60, Z=4×10+3×0=40, Z=4×50+3×0=200, Z=4×20+3×30=170, Hence, Zmax=200.