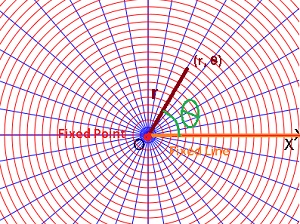
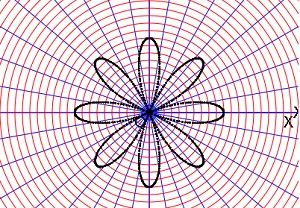
Polar coordinate system is a two-dimensional coordinate system in which each point on a plane is determined by a distance from a fixed point and an angle from a fixed straight line. If the distance from fixed pont is r and the angle from the fixed line is θ ,then the coordinate will be (r, θ).
For learn about Math functions of Mathematics and graphing, visit: Graphing Math functions of Math.
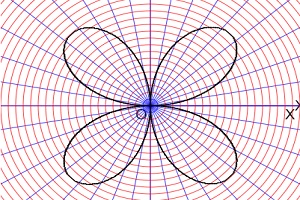
Free online graphing calculator for math for graph drawing website www.graph2d.com can draw any polar function. You can type 10cos(4t) for Polar rose in the input box and then press drawing button to get the graph.
For learn about Piecewise function of Mathematics and graphing, visit: Graphing Piecewise function of Math.
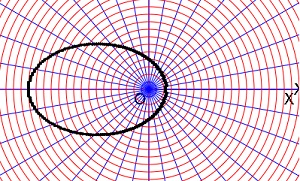
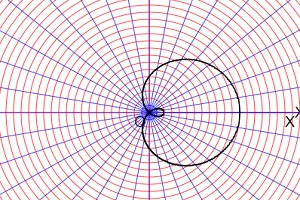
Free online graphing calculator for math for graph drawing website www.graph2d.com can draw any polar function. You can type 2/(1+.75cos(t)) for Polar ellipse in the input box and then press drawing button to get the graph.
For learn about Complex Analysis of Mathematics and graphing, visit: Graphing Complex Analysis of Math.