quran understand quran
understand quran quran

Free online graphing calculator for math functions 2d


User Manual for graphing

This is an online educational tools (free online graphing calculator for math geogebra) to make graph of mathematical functions of 2D. It can be used in science education. It is helpful of science students and teachers.Type any function in the input box and then press the drawing button. It takes sometimes to draw graph of this function.For zoom this graph, you can change the x-scale and y-scale. It can draw algebraic function, Trigonometic function, Inverse circular function, logarithmic function, exponential function, hyperbolic function,etc. You can see the user manual for properly use this online tools. Thank you for viewing this article.

1. The vedio Tutorial link: Youtube vedio tutorial for simple functions
2. Type the function with variable x and then press drawing.
3. You can change x-scale and y-scale in input boxes.
4. For algebraic function, you will type: abs(x) instead of |x|
sqrt(x) instead of sqaure root of x or x1/2, x^2 or x**2 instead of x2
log(x) instead of logx,ln(x) instead of lnx, e^x instead of ex
5. For trigonometric function, you will use in Radian angles and :
sin(x) instead of sinx, cos(x) instead of cosx
tan(x) instead of tanx,cosec(x) instead of cosecx
sec(x) instead of secx, cot(x) instead of cotx
6. For Inverse circular function, you will use in Radian angles and :
asin(x) instead of sin-1x, acos(x) instead of cos-1x
atan(x) instead of tan-1x, acosec(x) instead of cosec-1x
asec(x) instead of sec-1x, acot(x) instead of cot-1x
7. For hyperbolic function, you will type:
sinh(x) instead of sinhx, cosh(x) instead of coshx
tanh(x) instead of tanhx,cosech(x) instead of cosechx
sech(x) instead of sechx, coth(x) instead of cothx
8. For Inverse hyperbolic function, you will type:
asinh(x) instead of sinh-1x, acosh(x) instead of cosh-1x
9. If you need to write π, then you must write pi or PI or Pi
How to get update website

To get update website, you can clear your browser chache data (if you browse this website before many days) or browse this website with another website browser. Steps for clear chache: 1. on your computer, open browser. 2. At the top right, click More. 3. Click More tools. Clear browsing data. 4. choose a time range. 4. "Cached images and files," check the boxe. 5. Click Clear data. Different browser may have different ways.


Linear function and graph of linear function

Linear function y=f(x)=ax+b represent always straight line and can be sketch by joining only two points . As for example y=f(x)=2x+1 is a linear function which can be draw by joining two points (1,3) and (3,7). Free graphing calculator for math drawing website www.graph2d.com can draw any linear function. You can type 2*x+1 in the input box and then press drawing button to get the graph. You can also try to draw with the function f(x)=x, f(x)=3x+1, f(x)=-2x+3, f(x)=-x-5, f(x)=5x-1 etc. For learn about piecewise functions of Mathematics and graphing, visit: Graphing piecewise function of Math.

graph of linear function or graph of linear function calculator

A polynomial function of degree one or zero is called linear function. The graph of linear function is always represent a straight line which can be drawn by graph of linear function clculator,browsing link: Graphing calculator of Math

Quadratic function and graph of quadratic function.

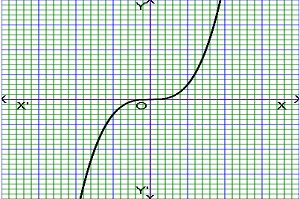
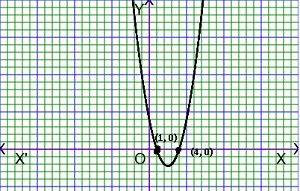
Quadratic function y=f(x)=ax2+bx+c always represent a parabola. If the co-efficient of x2 is positive , the parabola will be concave up and negative , the parabola will be concave down. For manually sketch the quadratic function graph, we will find two points for which y=f(x)=0 that means the parabola passes through this two points and the concavity of parabola depend on the co-efficient of x2 . As for example y=f(x)=x2-5x+4=(x-1)(x-4). If x=1 or x=4, then y will be zero.That means the parabola passes through (1, 0) and (4, 0). Since the co-efficient of x2 is 1 which is positive, so the parabola will be concave up. Geogebra Free graphing calculator for math graph drawing website www.graph2d.com can draw any qudratic function. You can type x**2-5*x+4 in the input box and then press drawing button to get the graph. You can also try to draw with the function f(x)=x2, f(x)=-x2, f(x)=x2+5x, f(x)=x2-3x, f(x)=x2+2x+5 etc.

graph of qudratic function or graphing calculator quadratic functions

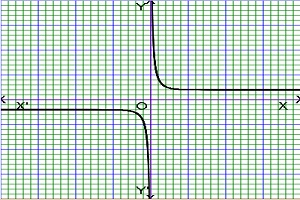
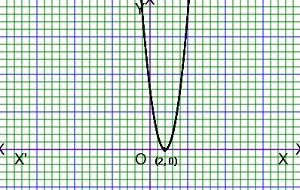
If we find only one point for which y=0, then the parabola touches x-axis on that point. As for example, y=f(x)=2(x-2) 2, there is only one point (2, 0) for which y=0, so the parabola touches x-axis at (2, 0) which is critical point. Since the co-efficient of x2 is 2 which is positive, so the parabola will be concave up. Free graphing calculator for math drawing website www.graph2d.com can draw any qudratic function. You can type 2*(x-2)**2 in the input box and then press drawing button to get the graph.

quadratic function graph

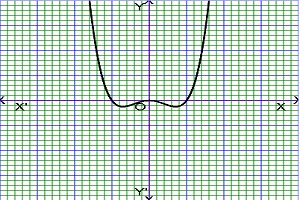
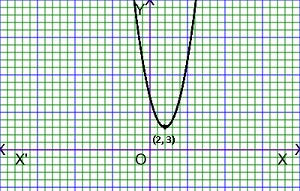
If we can not find any point for which y=0, then we will try to get a term of whole square. As for example, y=f(x)=x2-4x+7=(x-2) 2+3. When x=2, then the (x-2) 2=0 and hence y=3. So the point (2, 3) is a critical point. Since the co-efficient of x2 is 1 which is positive, so the parabola will be concave up. Free graphing calculator for math drawing website www.graph2d.com can draw any qudratic function. You can type x**2-4*x+7 in the input box and then press drawing button to get the graph. For learn about Implicit function of Mathematics and graphing, visit: Graphing Implicit function of Math.

quadratic function graph maker

A polynomial function of degree two is called quadratic function. The graph of quadratic function is always represent a parabola which can be drawn by quadratic function graph maker,browsing link: Graphing calculator of Math

Cubic function and graph of cubic function

Cubic function y=f(x)=ax3+bx2+cx+d represent a curve. At first we find the value of x for which y=0. If the number of same roots of y=0 is odd number, then that point the graph will crosses on x-axis and is even number , then the graph will touches on thex-axis. If the co-efficient of x3 is positive, then the curve will sketch from upper side of x-axis of right side and is negative, then the curve will sketch from lower side of x-axis of right side. As for example, y=f(x)=(x-3) 2(x-7),there are two(even number) same roots x=3 and one(odd number) root x=7 .So the curve touches at x=3 with x-axis and crosses at x=7 with x-axis. Since the co-efficient of x3 is 1 which is positive, so the curve will sketch from upper side of x-axis of right side. .Free online graphing calculator for math for graph drawing website www.graph2d.com can draw any cubic function. You can type (x-3)**2*(x-7) in the input box and then press drawing button to get the graph. You can also try to draw with the function f(x)=x3, f(x)=-x3, f(x)=x3 -4x2, etc. For learn about Calculator of Mathematics and graphing, visit: Graphing Calculator of Math.

graph of cubic function

A polynomial function of degree three is called cubic function. The graph of cubic function is always represent a continous curve which has maximum two turning point.. The graph of cubic function can be drawn by Graphing calculator of Math

Rational function and graph of rational function

Rational function y=f(x)=P(x)/Q(x) is a ratio of two polynomials P(x) and Q(x). As for example, y=f(x)=(x2+1)/x=x+1/x is a rational function. There are two asymptotes y=x and x=0.The graph of this rational function is two curves which are situated between this two asymptotes. Free online graphing calculator for math for graph drawing website www.graph2d.com can draw any rational function. You can type (x**2+1)/x in the input box and then press drawing button to get the graph. You can also try to draw with the function f(x)=x-1/x , f(x)=(x+1)/x , f(x)=1/x, f(x)=(x+1)(x+3)/(x-2) etc. For learn about complex analysis of Mathematics and graphing, visit: Graphing Complex analysis of Math.

graph of rational function or how to draw rational functions
Trigonometic function and graph of trigonometic function

Trigonometric function is a ratios of two side lengths of of a right-angled triangle. It is also called circular function. Free online graphing calculator for math for graph drawing website www.graph2d.com can draw any trigonometric function. You can type Math.sin(x) in the input box and then press drawing button to get the graph of sin(x).You can also change x-scale and y-scale. You can also try to draw with the function f(x)=cos(x), f(x)=tan(x), f(x)=cos(2x), f(x)=sin(2x), f(x)=tan(2x) etc. For learn about Linear Programming or Operation research of Mathematics and graphing, visit: Graphing Linear programming or operation research of Math.

graph of sine function or sine and cosine graph calculator
Inverse circular function and graph of inverse circular function

Inverse circular function is a arcus or inverse trigonometric or antitrigonometric function. Free online graphing calculator for math for graph drawing website www.graph2d.com can draw any antitrigonometric function or inverse circular function. You can type Math.asin(x) in the input box and then press drawing button to get the graph of sin-1(x).You can also change x-scale and y-scale. You can also try to draw with the function f(x)=cos-1(x), f(x)=tan-1(x), f(x)=sin-1(2x) etc. For learn about Inequality of Mathematics and graphing, visit: Graphing Inequality of Math.

graph of inverse circular function or graph of sin inverse x
Exponential function and graph of exponential function

Exponential function is a function which is denoted by f(x)=ax=exlna or f(x)= ex where the mathematical constant e =1+(1/1!)+(1/2!)+(1/3!)+... ...to ∞ and the value of e is approximately 2.718. Free online graphing calculator for math for graph drawing website www.graph2d.com can draw any exponential function function. You can type Math.exp(x) in the input box and then press drawing button to get the graph of ex.You can also change x-scale and y-scale. You can also try to draw with the function f(x)=e-x, f(x)=e-2x, f(x)=e-3x, f(x)=e2x, f(x)=e3x, f(x)=10x, f(x)=10-x,f(x)=5x etc. For learn about Polar function of Mathematics and graphing, visit: Graphing Polar function of Math.

graph of exponential function or exponential function graph calculator
Logarithmic function and graph of logarithmic function

Logarithmic function is a function which is denoted by f(x)=log(x) or f(x)= ln(x). Free online graphing calculator for math for graph drawing website www.graph2d.com can draw any logarithmic function. You can type log(x) in the input box and then press drawing button to get the graph of log(x).You can also change x-scale and y-scale. You can also try to draw with the function f(x)=log(2x), f(x)=log(3x-5), f(x)=5log(1-x), f(x)=ln(x), f(x)=ln(5x-2), f(x)=3ln(2x-1), f(x)=2+ln(x),f(x)=2-log(x) etc. For learn about Parametric function of Mathematics and graphing, visit: Graphing Parametric function of Math.

graph of logarithmic function or how to draw log functions
Transcendental function and graph of transcendental function

In Mathematics, The transcendental function is a function which is combination of Exponential function, logarithmic function, Trigonometric function, Inverse circular function etc i.e. transcendental function is not an algebriac function. As for example, sin(2x), tan(x), log(x), log(3x), ln(2x), sin-1(x), cot-1(x), ex, e-2x etc are transcendental functions. We can draw any graph of transcendental function with the free graph drawing website www.graph2d.com. As for example, the graph of f(x)=ex+sin(2x) is drawing by www.graph2d.com. For drawing type e^x+sin(2x) in the input box and then press drawing button to get the graph. The graph of that function is given bellows- For learn about Parallilogram law on Mechanics of Mathematics and graphing, visit: Graphing Parallilogram law on mechanics of Math.

graph of transcendental function or graphing transcendental functions examples
Odd function and graph of odd function

In Mathematics, The odd function f(x) is a function which is satisty f(-x)=-f(x). As for example, sin(x), tan(x), x3, x7 etc are odd functions.The odd functions are symmetric about origin. We can draw any graph of odd function with the free graph drawing website www.graph2d.com. As for example, the graph of f(x)=x3. For drawing type x^3 in the input box and then press drawing button to get the graph of the odd function f(x)=x3. The graph of that function is given bellows- For learn about Simple Calculator of Mathematics and graphing, visit: Simple Calculator of Math.

graph of odd function
Even function and graph of even function

In Mathematics, The even function f(x) is a function which is satisty f(-x)=f(x). As for example, cos(x), x2, x4 etc are even functions.The even functions are symmetric about y-axis. We can draw any graph of even function with the free graph drawing website www.graph2d.com. As for example, the graph of f(x)=x4-x2. For drawing type x^4-x^2 in the input box and then press drawing button to get the graph of the even function f(x)=x4-x2. The graph of that function is given bellows- For learn about Piecewise function of Math and graphing, visit: Graphing piecewise function of Mathematics.

graph of even function
Hyperbolic function and graph of hyperbolic function

In Mathematics, The hyperbolic function are similar to see the Trigonometric function or Circular function .The hyperbolic function are defined the combination of Exponential function ex and e-x. As for example, sinh(x)=(ex-e-x)/2, cosh(x)=(ex+e-x)/2, tanh(x)=(ex-e-x)/(ex+e-x),cosech(x)=2/(ex-e-x), sech(x)=2/(ex+e-x), coth(x)=(ex-e-x)/(ex+e-x). We can draw any graph of hyperbolic function with the free graph drawing website www.graph2d.com. As for example, the graph of f(x)=coth(x). For drawing type coth(x) in the input box and then press drawing button to get the graph of the hyperbolic function f(x)=coth(x). The graph of that function is given bellows- For learn about Implicit function of Mathematics and graphing, visit: Graphing Implicit function of Math.

graph of cothx function or hyperbolic function graph
Constant function and graph of constant function

In Mathematics, The constant function is a function whose range is a single element on whole domain. As for example, f(x)=5, f(x)=e, f(x)=π etc are constant functions . We can draw any graph of constant function with the free graph drawing website www.graph2d.com. As for example, the graph of f(x)=7. For drawing type 7 in the input box and then press drawing button to get the graph of the constant function f(x)=7. The graph of that function is given bellows- For learn about Complex analysis of Mathematics and graphing, visit: Graphing Complex analysis of Math.

graph of constant function
Square root function and graph of square root function

In Mathematics, The square root of a function is defined as f(x)=√(h(x)) where h(x) is another function. We can draw any 2d graph of square root function with the free graph drawing website www.graph2d.com. As for example, the graph of f(x)=√(2x+5). For drawing type sqrt(2x+5) in the input box and then press drawing button to get the graph of the square root function f(x)=√(2x+5). The graph of that function is given bellows- For learn about Linear programming of Mathematics and graphing, visit: Graphing linear programming of Math.

square root function graph
How to draw graph of any mixed function of algebric and trigonometric

The graph drawing website www.graph2d.com can draw any graph in 2D of mixed function of algebriac function and trigonometric function. As for example, the graph of f(x)=xsin2x. For drawing type xsin(x)^2 in the input box and then press drawing button to get the graph of mixed function f(x)=xsin2x. The graph of that function is given bellows- For learn about Inequality of Mathematics and graphing, visit: Graphing Inequality of Math.

combination function graph
Definition of Domain and Range of a function

The domain of a function y=f(x) is the set of all possible values of independent variable x and the range of a function y=f(x) is the set of all possible values of dependent variable y. The domain is denoted by Domf and the range is denoted by Rangf. From the graph of a function, we can determine the domain and range. As for example, y=f(x)=√(x+5). The graph is situated from -5 to ∞ on the horizontally . So Domf=(-5, ∞). Again the graph is situated from 0 to ∞ on the vertically . So Rangf=(0, ∞) For learn about Polar function of Mathematics and graphing, visit: Graphing Polar function of Math.

domain and range of a function or domain and range of a graph
Definition of ceiling and floor function

Ceiling function : The Ceiling function is a special type of function which has returns the smallest integer value which is greater than or equal to the specified number. The Ceiling function is denoted by f(x)=⌈x⌉. As for example, f(3.4)=⌈3.4⌉=4. The graph of ceiling function is given bellows-
graph of ceiling function
Floor function : The Floor function is a special type of function which has returns the largest integer value which is less than or equal to the specified number. The Floor function is denoted by f(x)=⌋x⌊ As for example, f(3.4)=⌋3.5⌊=3. The graph of floor function is given bellows-
graph of floor function

Linear cost function

A Linear cost function is used in Business to find out the total cost which is relation between total cost and total amount of production units. The linear cost function is denoted by f(x)=mx+c where f(x) is total cost, mx is variable cost, c is fixed cost, x is total production units and m is variable cost per unit production. As for example, A small ball pen factory has fixed cost $100, variable cost per pen is $5, then the cost function will be f(x)=5x+100. If this factory make 100 pcs ball pen, then variable cost=$5X100=$500 and fixed cost=$100, so total cost=$500+$100=$600 but if we use the cost function, we get f(100)=5X100+100=600.Again if thisball pen factory make 20 pcs ball pen, then total cost f(20)=5X20+100=200.
graph of linear cost function
suppose that a hostel has 5 members and total cost $250. If the hostel has 7 members, then the total cost $330. Now we make a linear relationship between number of hostel members and the total cost for finding the linear cost function. let (x1,y1)=(5, 250) and (x2,y2)=(7, 330). We know that the linear relationship is (x-x1)/(x1-x2)=(y-y1)/(y1-y2) ⇒ (x-5)/(5-7)=(y-250)/(250-330) ⇒(x-5)/(-2)=(y-250)/(-80) ⇒(x-5)/1=(y-250)/40 ⇒ y-250=40x-200 ⇒ y=40x-200+250 ⇒ y=40x+50. So the linear cost function for the hostel members is f(x)=40x+50 where the fixed cost is $50, variable cost per member is $40, variable cost for all members is $40x and the total cost=variable cost+fixed cost i.e. f(x)=40x+50. If the number of hostel members is 10, then the total cost be f(10)=40X10+50=450 dolars.

Relation between any function and its inverse function

If we draw graph of any function and its inverse function in same graph paper, then we see that the both graph are symmetric about the straight line y=x. Let us consider a rational function f(x)=(2x-1)/(x+1). Now we find the inverse function of this rational function. For finding the inverse function, substituting x by f-1(x) in this rational function, we get, f(f-1(x))=(2f-1(x)-1)/(f-1(x)+1) ⇒x=(2f-1(x)-1)/(f-1(x)+1) ⇒xf-1(x)+x=2f-1(x)-1 ⇒ xf-1(x)-2f-1(x)=-x-1 ⇒ f-1(x)(x-2)=-x-1 ⇒ f-1(x)=(-x-1)/(x-2) ⇒ f-1(x)=(x+1)/(2-x) Now we drawing the graph of this rational function and its inverse function in the same graph paper with free graphing calculator, then we get the graph of function f(x) with red color and the inverse function f-1(x) with blue color. We oserve that the both graphs(red curve and blue curve) are symmmetric about the straight line y=x with black color line. This observation(symmetric graph of any function and its inverse function about the straight line y=x ) are applicable for any function and its inverse function which is the relation between any function and its inverse function.
graph of relation between any function and its inverse function