Let us consider the parametric function x=f(t), y=g(t) for finding the asymptote of parallel to the co-ordinate axes. If t→t1, y=g(t)→∞ such that x→a then x=a is an asymptote. Again If t→t1, x=f(t)→∞ such that y→b then y=b is an asymptote.
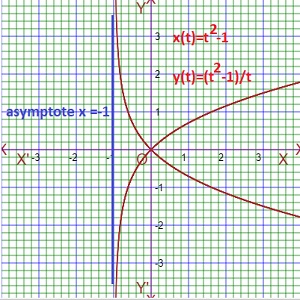
As for example, x(t)=t2-1 and y(t)=(t2-1)/t. When t→0 then y(t)→∞ or y(t)→-∞ such that x→-1, hence x=-1 is an asymptote of parametric function. The graph of this parametric function and its asymptote is given belows.
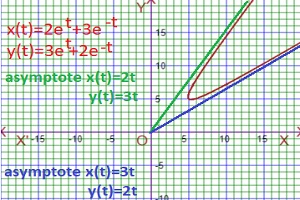
Again consider the parametric function x(t)=2et+3e-t and y(t)=3et+2e-t for finding oblique asymptote.If t→∞,then the slope=(dy/dt)/(dx/dt)=(3et-2e-t)/(2et-3e-t)=(3-2e-2t)/(2-3e-2t)→3/2, hence the asymptote will be y=(3/2)x ⇒2y=3x so the parametric equation of this asymptote is x(t)=2t and y(t)=3t.
If t→-∞,then the slope=(dy/dt)/(dx/dt)=(3et-2e-t)/(2et-3e-t)=(3e2t-2)/(2e2t-3)→2/3, hence the asymptote will be y=(2/3)x ⇒3y=2x so the parametric equation of this asymptote is x(t)=3t and y(t)=2t. The graph of parametric function and its asymptotes are given belows.